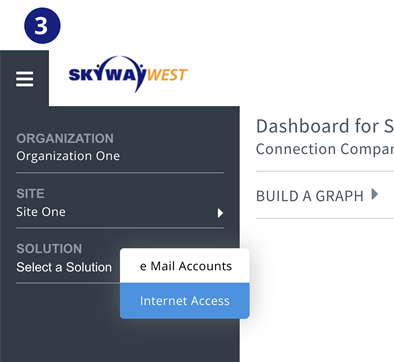
How to Use Skyway's Real-time Data Customer Portal

Get real-time data across your Sites and Services. Follow these steps to get started.

Our MSP and Customer Portal is a multi-tenant permission-based portal available with any service that uses Skyway IP addresses and can be added to any internet service, regardless of provider. Permission-based login allows users to have Administrator, E-mail and/or DNS related access. Please contact support@skywaywest.com to add additional contacts and permissions.

Getting Around: Navigation

Step #1

If you have access to multiple Organizations, use the left hand navigation panel to choose which Organization you’d like to view. If your access is for one Organization, this selection will be made for you.

Hint: Expand the size of the main content area by toggling on the “hamburger” menu ( Ξ ) at the top left to show and hide the left navigation panel.

Step #2

If your Organization has a single Site, the Site selection will be made for you. If you have multiple Sites, choose the Site where you’d like to edit settings or view data.

Hint: If you’re viewing an Organization with more than one Site, in the main content area the subheading under “Dashboard for:…” will say “Site Comparison”, and below that there will be a Section titled “Build a Graph”. Here you can build graphs (see Hint 4 in “Viewing and Building Graphs” below) to compare performance data between your Sites.

Step #3

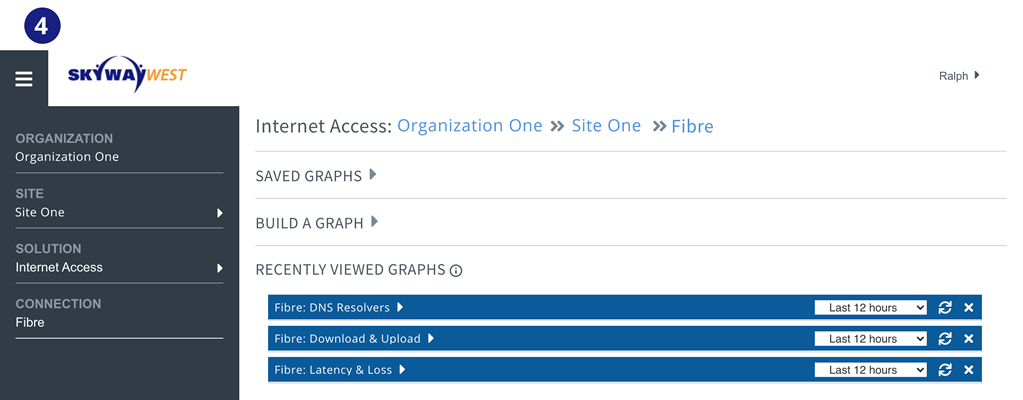
Now choose the Solution you’d like to edit or view for your Site. The current possibilities are Internet Access, e-Mail Domains, e-Mail Accounts or DNS Domains. For Sites with only one Solution, this will be populated for you. 

Use e-Mail Domains to set spam and virus settings and block/allows lists that apply to all email accounts. Select e-Mail Accounts to add new e-Mail accounts, customize e-Mail settings by user and set vacation messaging. DNS Domains is for setting forward lookups for domains added by Skyway West support. Internet Access is where you can view Real-time data…

Step #4

Internet Access is where you can view Real-time performance data for your services. The main content area now shows three sections: Saved Graphs, Build a Graph and Recently Viewed Graphs

Hint: In the main content area, Sections and Graphs can be expanded and collapsed to reduce clutter. Hovering over the information icons in this area displays contextual help.

Viewing and Building Real-time Data Graphs

Tip #1

Expanding Saved Graphs shows the types of graphs available and any graphs previously saved. The most useful available graphs cannot be deleted from Saved Graphs and are set to auto build on the page (this can be turned off). They include DNS Resolvers, Download and Upload and Latency and Loss. DNS Resolvers refers to the Domain Name Server(s) that your Internet Access Solution is using for DNS look ups.

Tip #2

All graphs appear under Recently Viewed GraphsThe default time frame displayed is the last 12 Hours. The time frame can be changed with the drop-down on the graph, or by zooming on the graph with mouse wheel or trackpad. In the example below we are viewing a Fibre Download and Upload graph, and we have moused over the graph to display detail for 5:14 A.M. 

Tip #3

Modify or build new graphs in the Build a Graph section. To modify an existing graph, click the pencil icon in Saved Graphs which will open Build a Graph. Here you can add different data time series to one graph, including DNS Resolvers, Download and Upload, Latency and Loss for a single service or for multiple services at the same Site. When you create a custom graph, you must name it in order to save.

Tip #4

An organization with multiple sites can build graphs to compare services between sites. Click on the Organization in the left navigation panel to access Site Comparison. In the example below we are building a basic new graph comparing Fibre Upload performance between site One and Site Two.